

How to Do a Financial Analysis: A Guide With Real Examples
6/9/2025 | 13 min read
Table of Contents
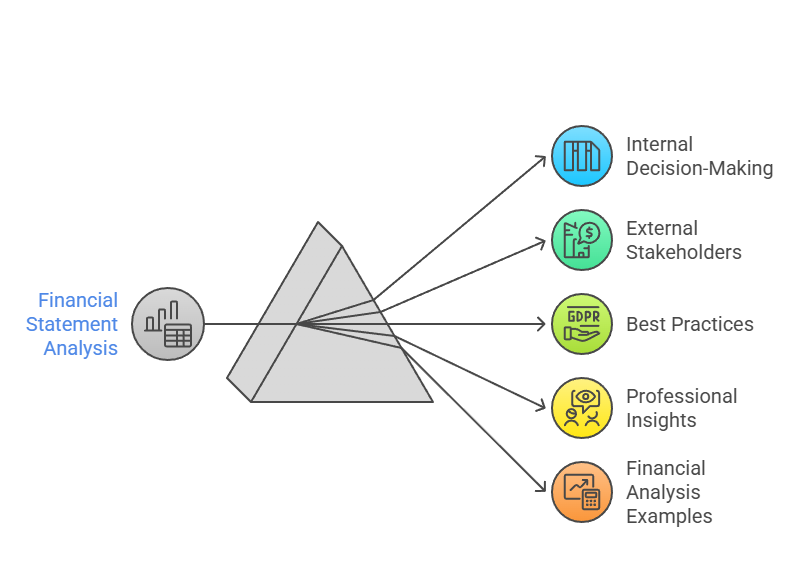
Financial statement analysis is the process of examining a company’s financial statements to evaluate its performance and determine its business value. How to do a financial analysis? This analysis is vital for both internal decision-making and external stakeholders such as investors, lenders, and regulators. Whether you're a startup founder, a financial manager, or an investor, understanding how to analyze financials can lead to smarter, data-backed decisions.
In this detailed guide, we combine best practices with professional insights and financial analysis examples to show you how to conduct a robust report on financial analysis. We’ll cover:
What financial statement analysis is and why it matters
The three core financial statements used in financial analysis
Key techniques: horizontal, vertical, and ratio analysis
Most common financial metrics used in business performance evaluation
How to conduct a plan vs actual analysis
Use cases and advantages of outsourcing financial analysis
Tools and methods for conducting a financial analytical report
What Is Financial Statement Analysis?

Financial statement analysis involves evaluating financial reports (balance sheet, income statement, and cash flow statement) to assess a company’s performance. It provides insight into profitability, liquidity, solvency, efficiency, and valuation.
Analysts typically rely on several techniques: horizontal analysis (trend analysis), vertical analysis (common-size analysis), and ratio analysis. These methods are essential in any financial reporting and analysis sample.
Key stakeholders include:
Internal users: CFOs, founders, and finance teams use financial analysis to guide strategic planning and operations.
External users: Investors, banks, and regulators use financial analysis to gauge financial health and make investment or lending decisions.
Companies may perform financial analysis accounting on a regular basis to identify strengths, weaknesses, and future opportunities. A solid finance analysis report helps interpret financial statements effectively. This process forms the backbone of financial statement evaluation, financial statement analysis and interpretation, and analysis of financials.
The Core Financial Statements You Need
According to GAAP (Generally Accepted Accounting Principles), companies must produce the following three statements:
1. Balance Sheet
Displays the company’s financial position at a given point in time. Key elements:
Assets: What the business owns (e.g., cash, inventory, equipment).
Liabilities: What the business owes (e.g., loans, accounts payable).
Equity: The residual value after liabilities are deducted from assets.
The equation: Assets = Liabilities + Shareholders’ Equity.
Balance sheet ratios include:
Debt-to-equity
Current ratio
Quick ratio
Days sales outstanding (DSO)
Balance sheet analysis helps detect liquidity risks and capital structure issues. When you analyze balance sheet trends over time, this becomes part of your broader analysis of financial statements.
2. Income Statement
Shows the company’s revenues and expenses over a period to calculate net income.
Breakdown:
Revenue
COGS (Cost of Goods Sold)
Gross Profit
Operating Expenses (e.g., salaries, marketing)
Operating Profit (EBIT)
Interest & Taxes
Net Income
Conducting horizontal analysis income statement and vertical analysis of income statements reveals insights about cost structures and revenue efficiency. An analytical income statement or statement of analysis supports deeper evaluations.
3. Cash Flow Statement
Explains how cash is generated and used in operations, investing, and financing. It connects net income with cash balance.
Sections:
Operating activities
Investing activities
Financing activities
Important metrics:
Free cash flow
EBITDA (Earnings Before Interest, Taxes, Depreciation, and Amortization)
Operating cash flow
📊 Core Financial Statements You Need
| Statement | Description | Purpose |
|---|---|---|
| Balance Sheet | Summarizes a company’s assets, liabilities, and equity at a specific point in time. | Assesses financial position and solvency. |
| Income Statement | Reports revenues, expenses, and profits over a period. | Evaluates profitability and operational efficiency. |
| Cash Flow Statement | Tracks the flow of cash from operating, investing, and financing activities. | Monitors liquidity and cash management. |
| Free Cash Flow | Calculates cash available after capital expenditures. | Used for valuation and investment analysis. |
📈 Key Financial Metrics to Track
| Metric | Where It’s Found | Why It Matters |
|---|---|---|
| Gross Profit Margin | Income Statement | Indicates profitability after direct costs. |
| Operating Profit Margin | Income Statement | Reflects profitability from core operations. |
| Net Profit Margin | Income Statement | Shows overall profitability after all expenses. |
| Debt to Equity Ratio | Balance Sheet | Evaluates financial leverage and risk. |
| Quick Ratio | Balance Sheet | Assesses liquidity and short-term solvency. |
| ROA / ROE | Comprehensive Analysis | Measures asset/equity efficiency in generating profit. |
| EBITDA | Cash Flow / Income Statement | Shows earnings before non-operating costs. |
📌 Plan vs Actual Analysis: Bridging Forecast and Reality
| Component | Description | Actionable Insights |
|---|---|---|
| Planned Budget | Initial financial forecasts and projections. | Establishes benchmarks for performance evaluation. |
| Actual Performance | Reported figures from financial statements. | Highlights areas of variance. |
| Variance Analysis | Compares planned vs. actual data. | Identifies causes of over/underperformance. |
| Forecast Adjustments | Updated estimates based on current trends. | Improves strategic planning accuracy. |
Step-by-Step: How to Analyze Financial Statements
Step 1: Prepare Your Data
Collect 3-5 years of historical data. Ensure it is accurate, complete, and consistent. You can use accounting software like QuickBooks or NetSuite, or hire professionals to generate clean, GAAP-compliant reports. A sample of financial statement analysis often starts with reliable data.
Step 2: Apply the 3 Main Techniques of Financial Statement Analysis
Horizontal Analysis
Compare financial performance over multiple time periods to identify trends and growth patterns. This is sometimes called trend analysis of financial statements.
Example: Revenue growth from $1M to $1.3M in two years indicates a 30% increase. It’s a common example of a financial statement analysis.
Vertical Analysis
Express each line item as a percentage of a base item (e.g., revenue or total assets) to assess cost structures and capital efficiency.
Example: If marketing expenses are 20% of total revenue, you can evaluate efficiency against industry benchmarks. Vertical horizontal analysis helps in comparing these percentages over time.
Ratio Analysis
Quantifies relationships between different financial statement elements. These ratios are grouped as:
Liquidity Ratios: Current ratio, quick ratio
Profitability Ratios: Gross profit margin, return on assets (ROA), return on equity (ROE)
Efficiency Ratios: Inventory turnover, accounts receivable turnover
Leverage Ratios: Debt-to-equity, interest coverage
Use these ratios to perform cross-sectional and time-series comparisons. This can be compiled into financial statement analysis reports, such as an example of financial statement analysis report.
Key Financial Metrics to Track
For startups and growing businesses, tracking the right metrics is essential. Here are core financial metrics for startups:
Gross Margin = (Revenue - COGS) / Revenue
Burn Rate = Monthly net cash outflow
Cash Runway = Cash balance / Monthly burn
MRR (Monthly Recurring Revenue)
Customer Acquisition Cost (CAC)
Customer Lifetime Value (LTV)
LTV/CAC Ratio
These metrics should appear in any financial report and analysis or financial statement analysis company report.
Plan vs Actual Analysis: Bridging Forecast and Reality

Plan vs actual analysis helps determine how well your company is executing its financial plans. This comparison highlights:
Over/underperformance in sales, margins, and net income
Unexpected cost overruns
Operational inefficiencies
Example: If forecasted Q1 net profit was $50,000 but actual profit was $30,000, investigate variance in cost of goods, marketing ROI, or revenue assumptions.
Financial forecast vs actual reviews are critical for investor relations and internal accountability. They are part of a broader financial statement analysis and reporting.
Free Cash Flow and Valuation Analysis
Analysts use free cash flow (FCF) and discounted cash flow (DCF) modeling to estimate company valuation.
Free Cash Flow Formula:
FCF = Operating Cash Flow - Capital Expenditures
This is used in:
Business valuation
Investment analysis
Strategic planning for IPO or M&A
These methods are key techniques of financial statement analysis and part of corporate financial statement analysis.
Why Outsource Financial Analysis?
Hiring a full in-house FP&A team can be costly. Outsourcing gives you access to global finance talent while maintaining flexibility and cost efficiency.
Outsource Work offers:
Clean and accurate financial reports
Custom KPI dashboards
Variance reports and plan vs actuals
Budgeting and forecasting
Support for board meetings and investor updates
Our Eastern European professionals (Ukraine, Estonia, etc.) provide expert-level service with significant cost savings. We specialize in financial reports and analysis, report of financial analysis, and analysis accounting.
Advantages of Financial Statement Analysis
Identifies financial trends and issues early
Improves operational efficiency
Enhances investor and board confidence
Facilitates better business forecasting
Helps in valuation and fundraising
Supports compliance with financial statement analysis standards and definition financial statement analysis best practices
Did You Know?

The analysis of financial statement is a core element in MBA programs and investment banking.
Analyzing an income statement helps businesses uncover cost anomalies.
A well-structured financial statement analysis format includes trends, ratios, commentary, and visuals.
Tools like Excel, Power BI, and Looker are widely used in financial statement trend analysis.
A report on financial statement analysis may support funding rounds or credit evaluations.
What is financial statements analysis? It's a critical tool in evaluating performance.
Explore examples of financial statement analysis, how to analyse a financial statement, and how to analyse financial reports to boost your reporting confidence.
You Have to Know!

How to do financial statement analysis starts with data preparation and follows through structured techniques.
Finance report analysis enables clearer insight into profitability.
Learn how to analyse financial data like a pro.
Real financial report analysis examples reveal what top-performing companies monitor monthly.
Master the basics of financial statement analysis to build your strategic decision-making skills.
See a sample financial statement analysis to understand reporting formats.
Pay Attention!
When performing financial statement analysis in accounting, consistency across periods is key.
Your financial statement analysis report should reflect both trends and anomalies.
Don’t miss adding commentary to your financial statement analysis valuation.
Always ask, what is the financial statement analysis telling you about liquidity or solvency?
Every financial statement analysis company process must prioritize accuracy and context.
Work With Us! Join Today – Start Saving Money Tomorrow!
Looking for financial statement analysis and valuation experts? We’ve got you covered.
Need to analyze financial statements for investor decks? We deliver results in days.
Access Eastern European professionals for your financial statement analysis and reporting needs.
We provide accurate examples of financial statements analysis report to benchmark your progress.
Use our services to analyse financial data, interpret analysis financial statements, and create custom financial statement analysis example reports.
FAQs: Financial Analysis & Reporting
What is a financial analysis report?
It’s a document summarizing a company's financial performance using key metrics, visualizations, and insights. It includes a review of balance sheet analysis, income, and cash flows.
What is an example of financial analysis?
A startup notices decreasing net margins. Analysis shows rising customer acquisition costs. As a result, the business reallocates its marketing budget. This is a classic example financial statement analysis.
What are the techniques of financial statement analysis?
Horizontal analysis
Vertical analysis
Ratio analysis
Variance analysis
Trend and comparative analysis
Financial statement analysis and valuation techniques
How do I analyze financials if I’m not a CFO?
You can use templates or hire a part-time FP&A professional through Outsource Work. We’ll guide you through how to analyze financial statements or how to analysis financial statements.
What is the difference between horizontal and vertical analysis?
Horizontal analysis compares changes over time; vertical analysis shows how individual items relate to a base figure. Combining both provides a comprehensive view known as horizontal vertical analysis.
How to analyze a company’s financial statements?
Start with the income statement and analyze financial statements for revenue, costs, and net income. Then, review the balance sheet and cash flow for liquidity and capital structure. Use financial statement analysis techniques and financial statement analysis reports.
Can financial analysis be outsourced?
Yes. Companies often outsource FP&A, reporting, and variance analysis to experts to save time and ensure accuracy.
Contact Outsource Work
Contact Us Today
Email: serhii@outsource-work.com
Phone: +1 762 353 0600
Locations
801 Barton Springs Rd, Austin, TX 78704, United States
Pärnu mnt. 139b-14, 11317 Tallinn, Estonia
Website: https://outsource-work.com